![]()
![]()
Orli
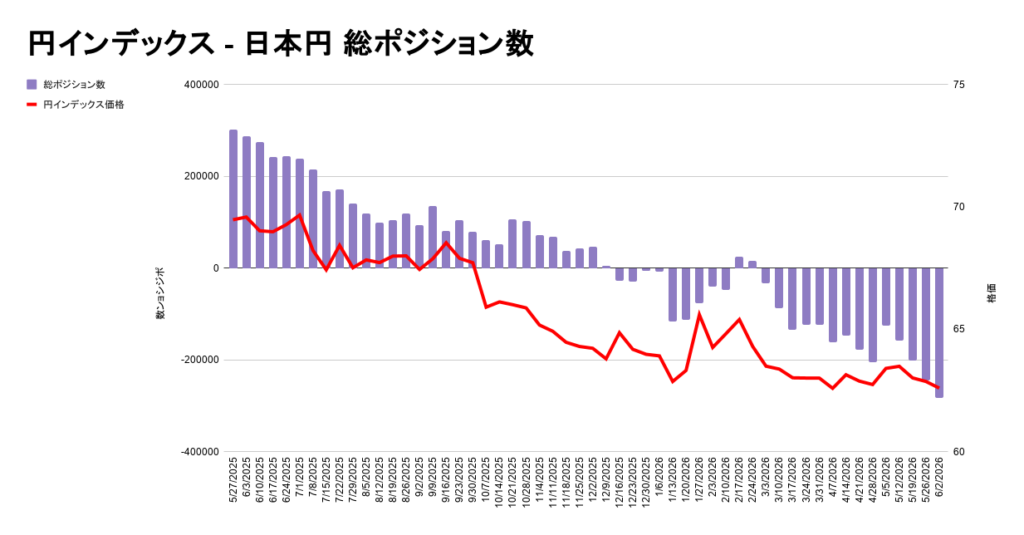
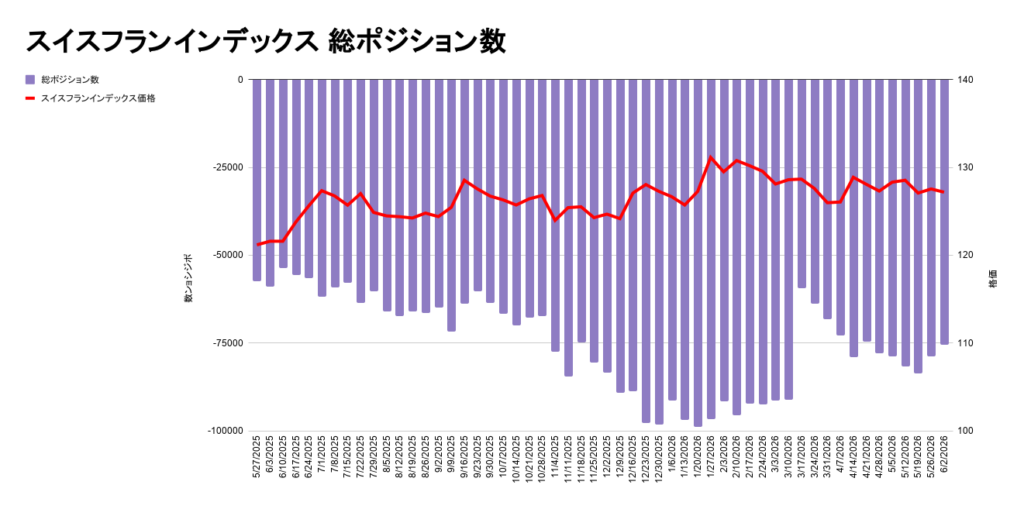
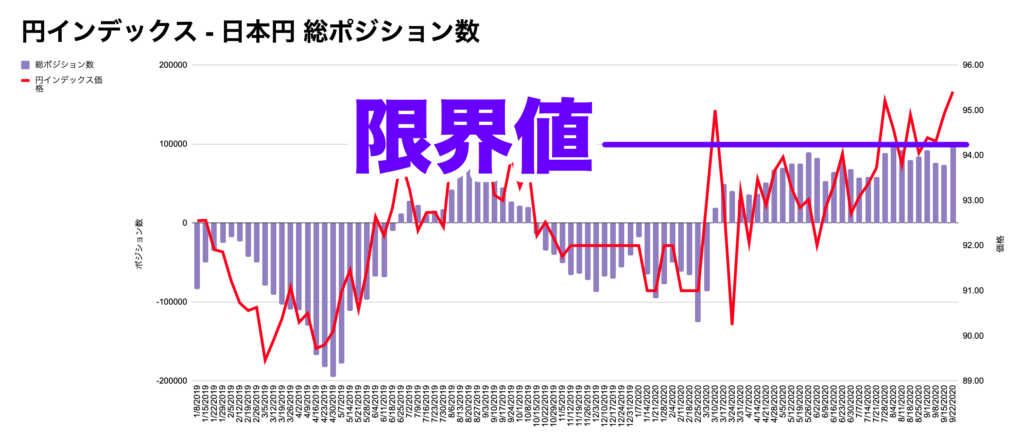
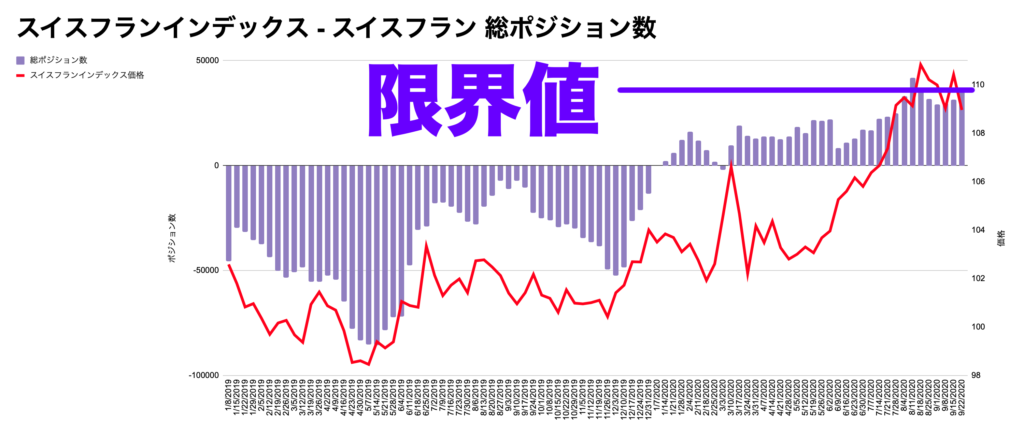
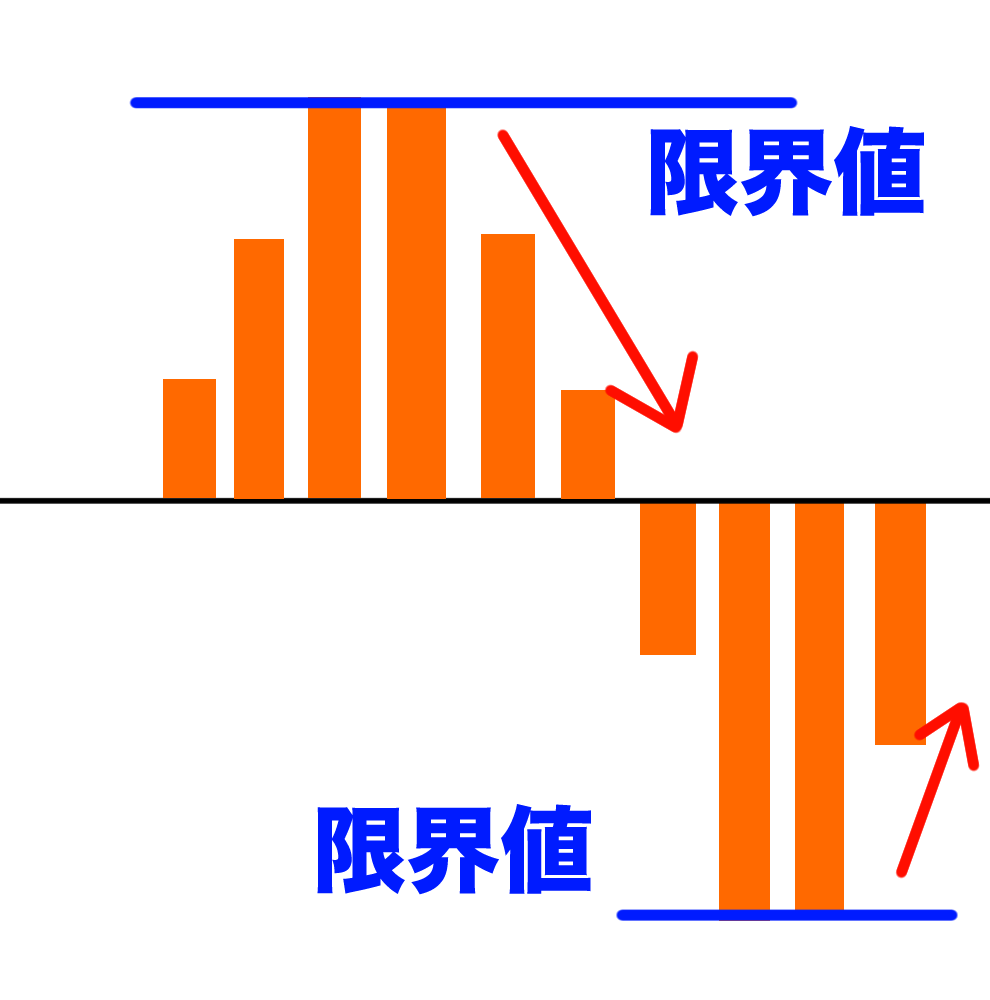
The amount of position tends to convert when it hits a limiting value.
![]()
![]()
Kanae-san
That means yen/franc will be sold and risked on in the future</span span>I guess that's the process!
![]()
Orli
I'm considering that possibility.
![]()
Orli
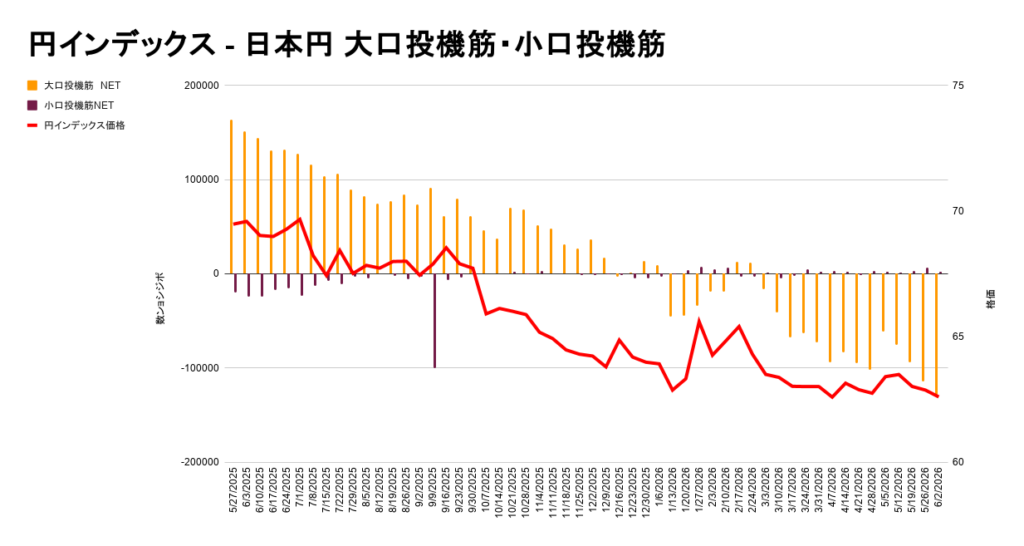
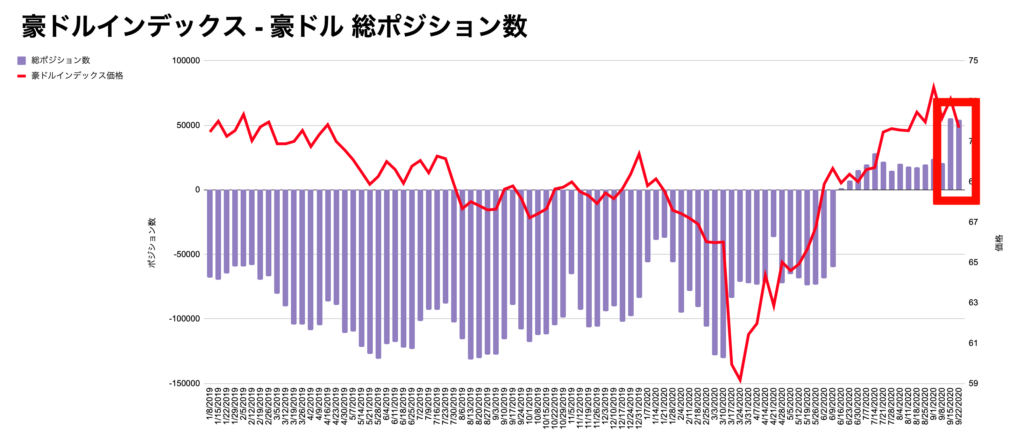
The Australian dollar tends to be sold at risk-off and bought at risk-on, the opposite of the yen and the franc.
![]()
Orli
The Australian dollar is heavily overbought for the second week in a row.
![]()
![]()
Kanae-san
It's true!
![]()
Kanae-san
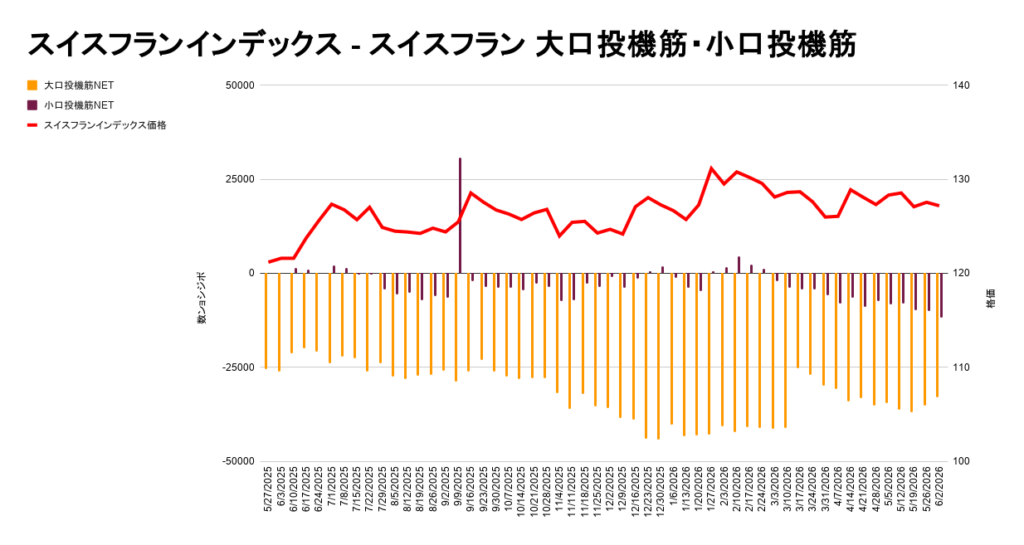
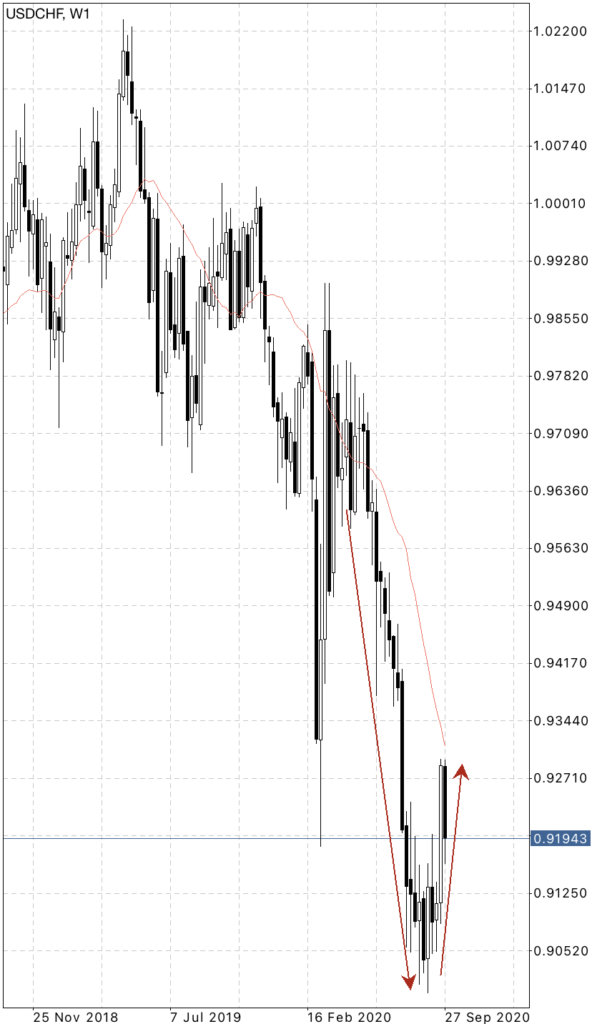
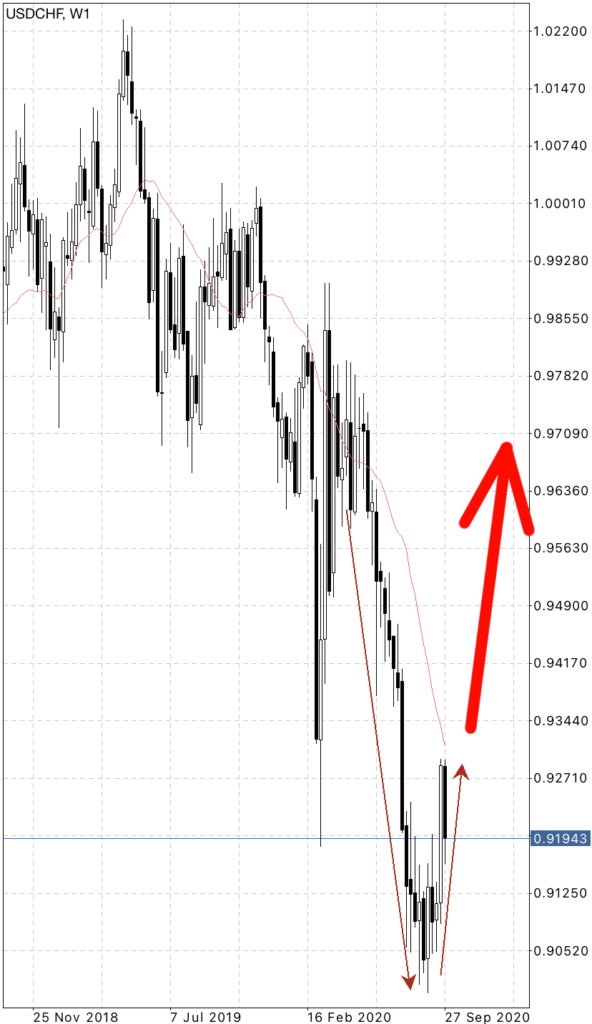
Oh! You said before that flan was going to be sold, didn't you?
![]()
Kanae-san
The dollar franc has made a nice turn! Orli somewhat God!
![]()
![]()
Orli
Thank you ^^
![]()
Orli
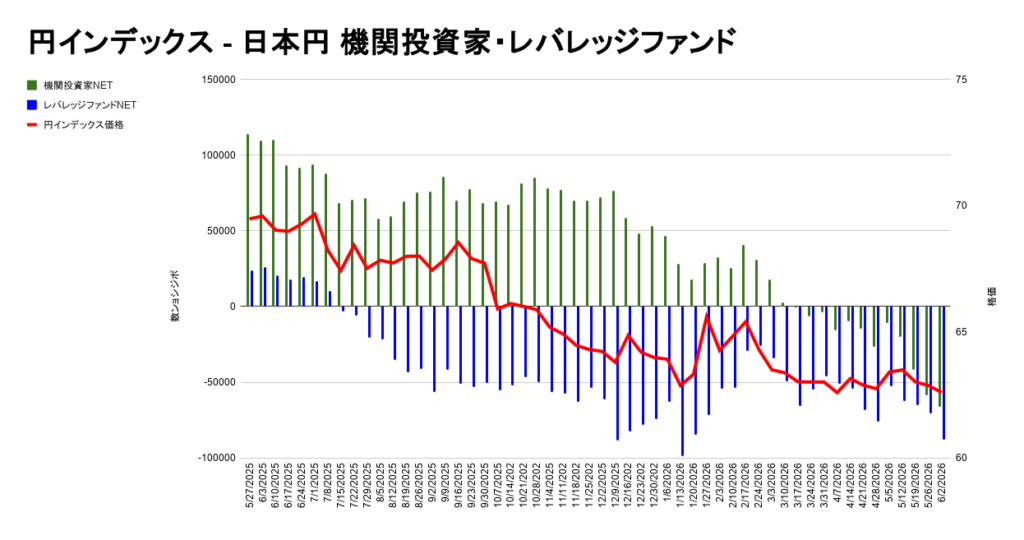
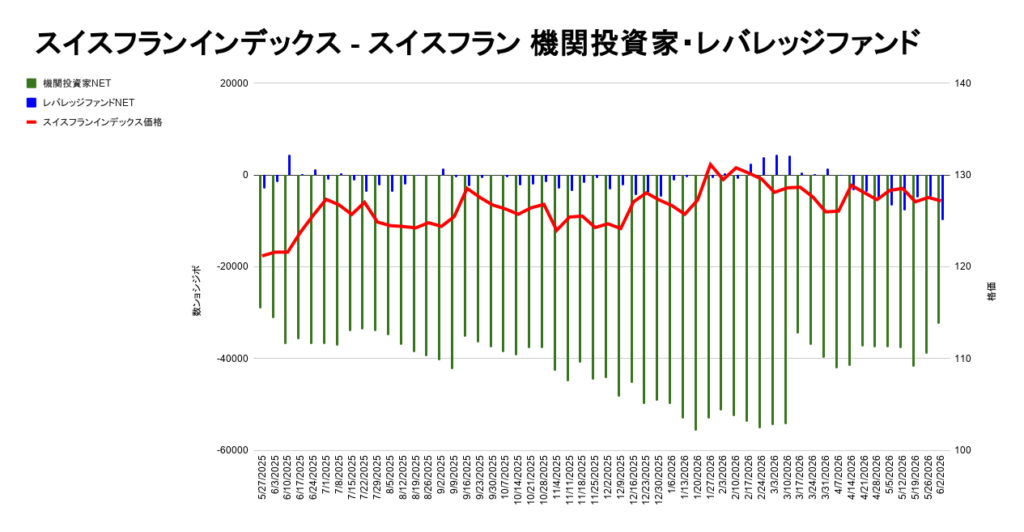
Because the volume of buying positions in the yen and the franc is at the limit this time, I think the dollar franc still has room to rise as well.
![]()
![]()
Kanae-san
Well, you were right about the back currency pair going up when they sell off, right?
![]()
Orli
You're learning well! Dollar franc rises on franc selling, Rolling on franc buying.
![]()
![]()
Kanae-san
So far I understand the rationale for being risk-on in Forex!
![]()
Kanae-san
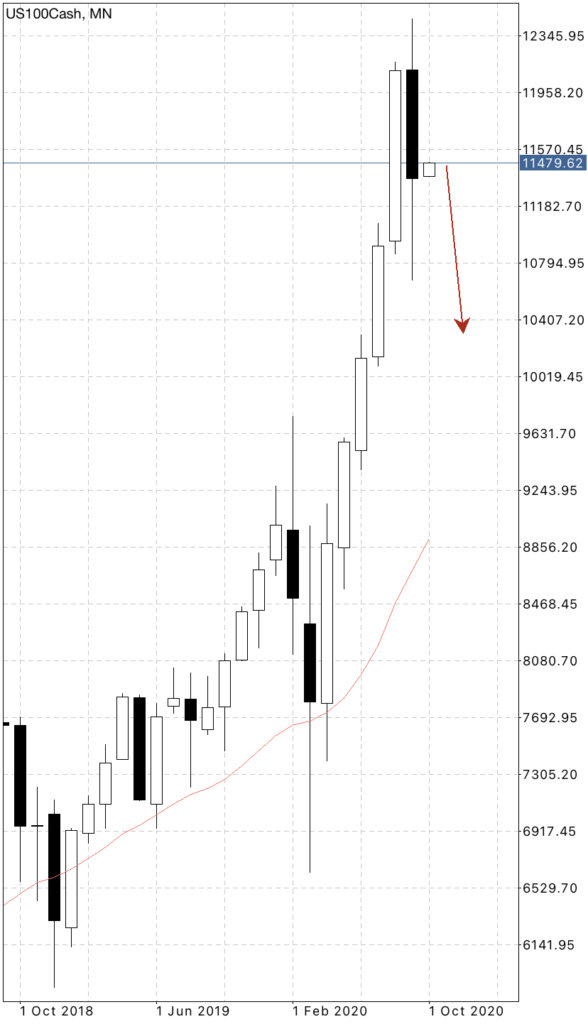
But what is the basis for the possibility of the stock only falling?
![]()
Orli
I'll explain next.
Fear indices and 10-year bonds move to pre-Corona shock! Only the stock price could fall again!
![]()
Orli
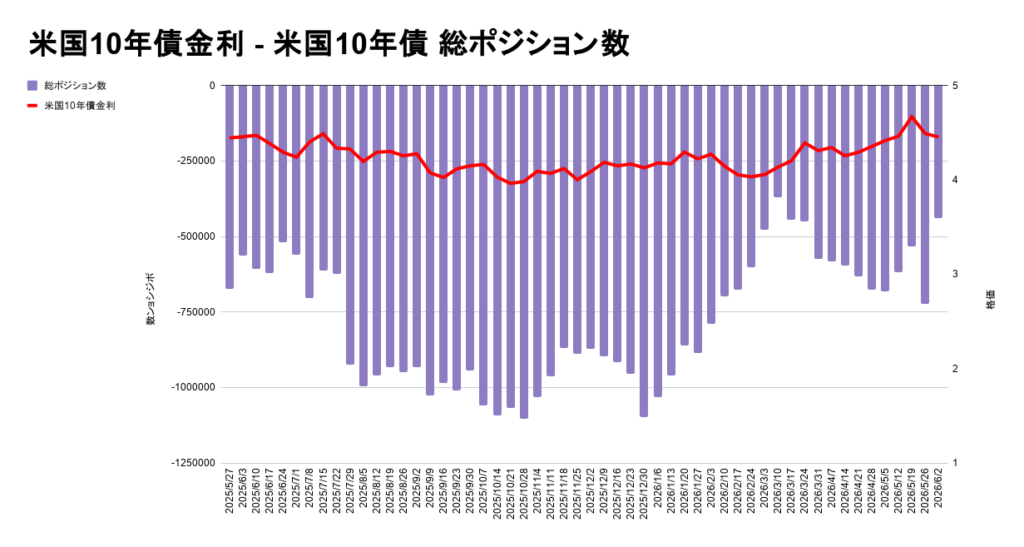
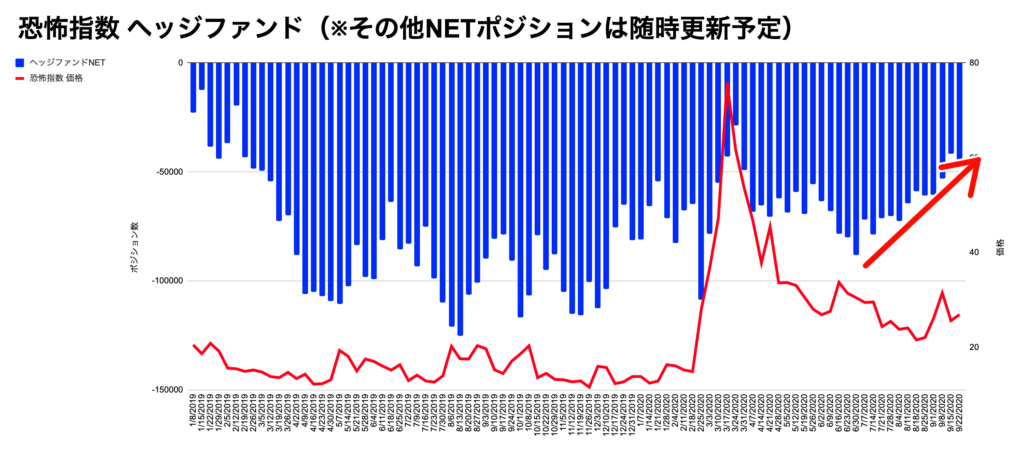
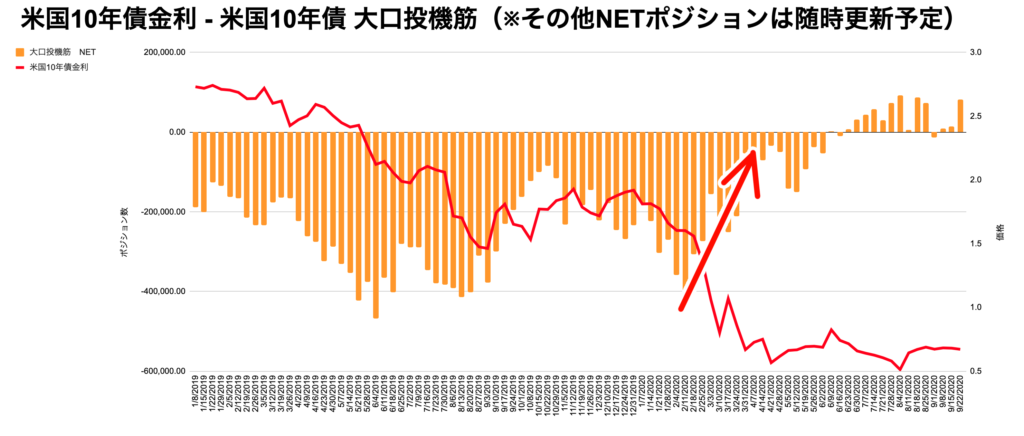
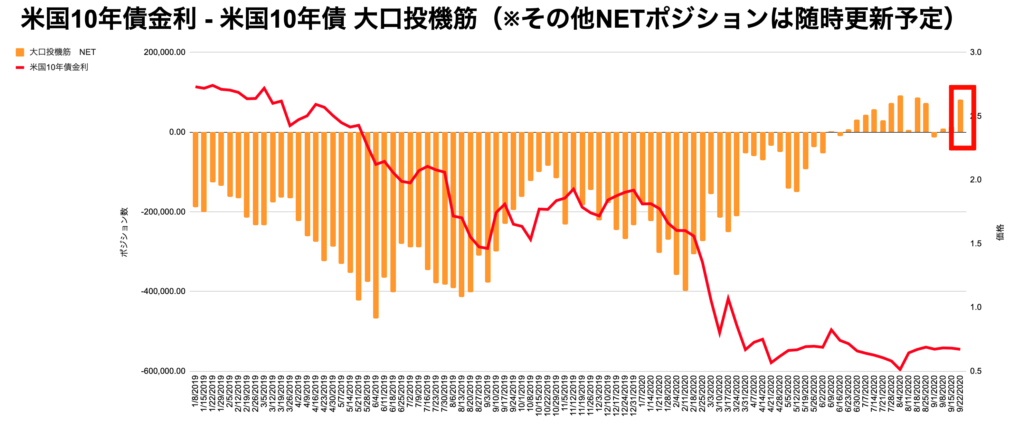
Here's the Fear Index and 10-year Treasury Rate Chart, and Fear Index and the amount of the 10-year bond position.
![]()
![]()
![]()
![]()
Orli
Try to find out what these two have in common.
![]()
Kanae-san
Well - the selling position is gradually decreasing.
![]()
Kanae-san
Oh! This is similar to before the corona shock!
![]()
Orli
I like the way you look at it!
![]()
Orli
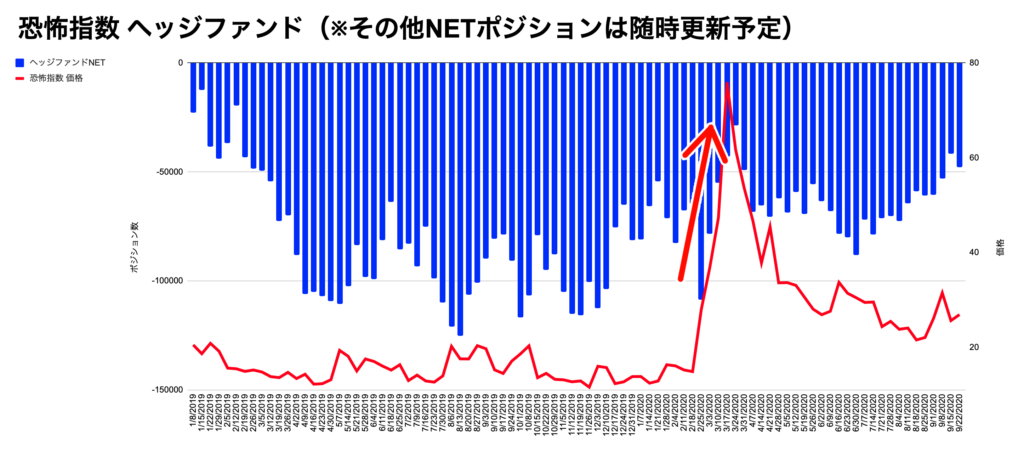
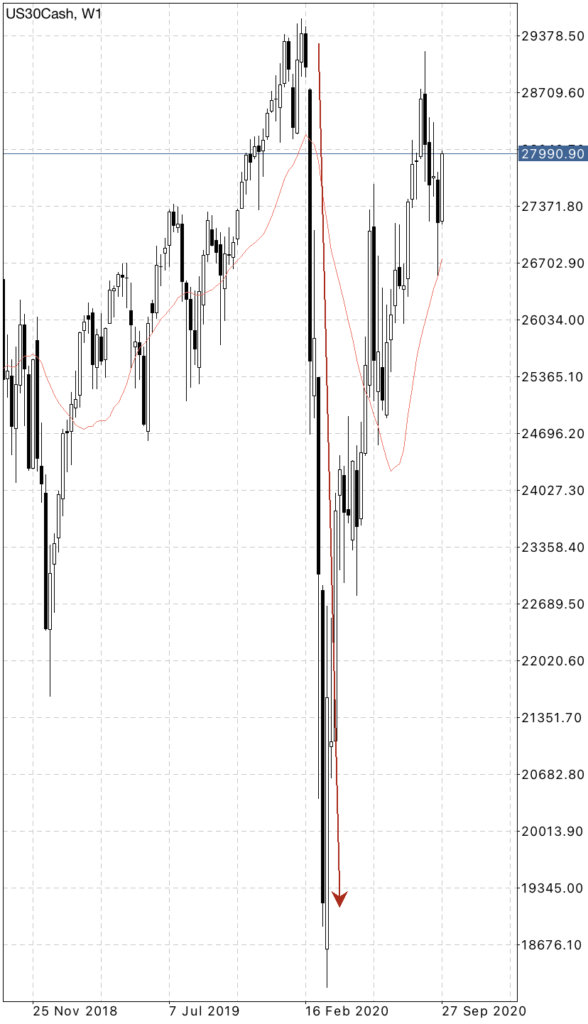
In fact, there was a similar move before the March corona shock.
![]()
![]()
![]()
Orli
After these two selling positions were unwound, the stock market crashed with the Corona shock came.
![]()
![]()
Kanae-san
This was another great guess! Orli somewhat God!
![]()
Orli
Thank you ^^
![]()
Orli
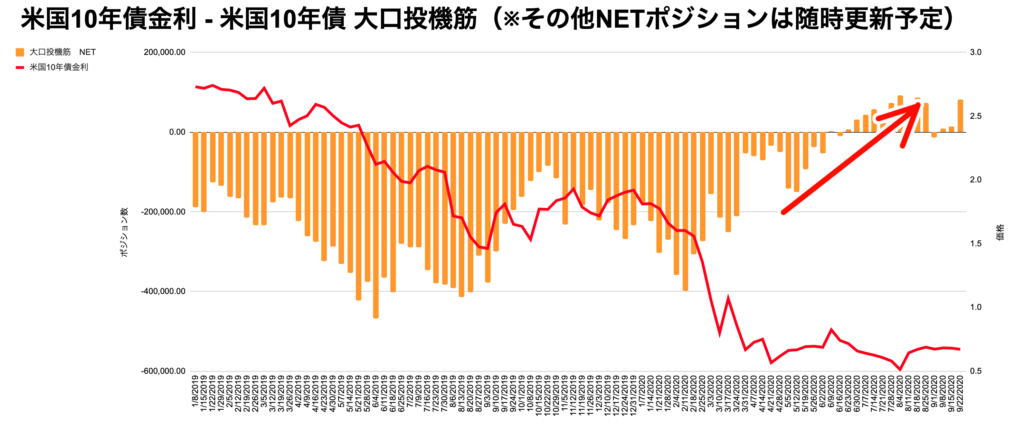
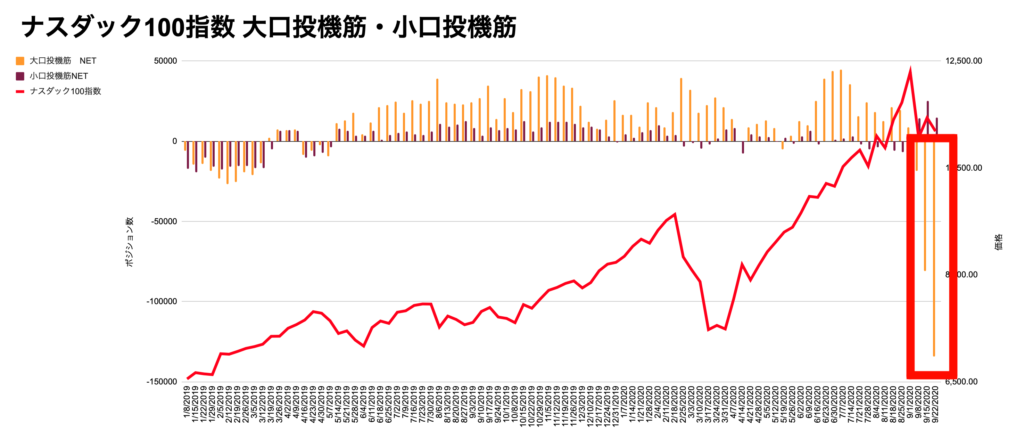
The volume of positions on the 10-year Treasury note was especially bought as the volume of positions on the Nasdaq sold off to a record high.
![]()
![]()
![]()
Orli
From here, we can consider the possibility that the portion of the Nasdaq short has been turned over to the 10-year Treasury long.
![]()
Kanae-san
I see~.
![]()
Orli
Once again, the possibility of another stock market decline has emerged from a move similar to the one before the Corona shock, this time with a fear index and two 10-year bonds.
![]()
Orli
However, given the risk-on move in the FX position, we believe that if the stock price falls again, it will only end in a correction.
![]()
![]()
Kanae-san
In other words, if it falls, it's going to go up again like the Nasdaq is doing now?
![]()
Orli
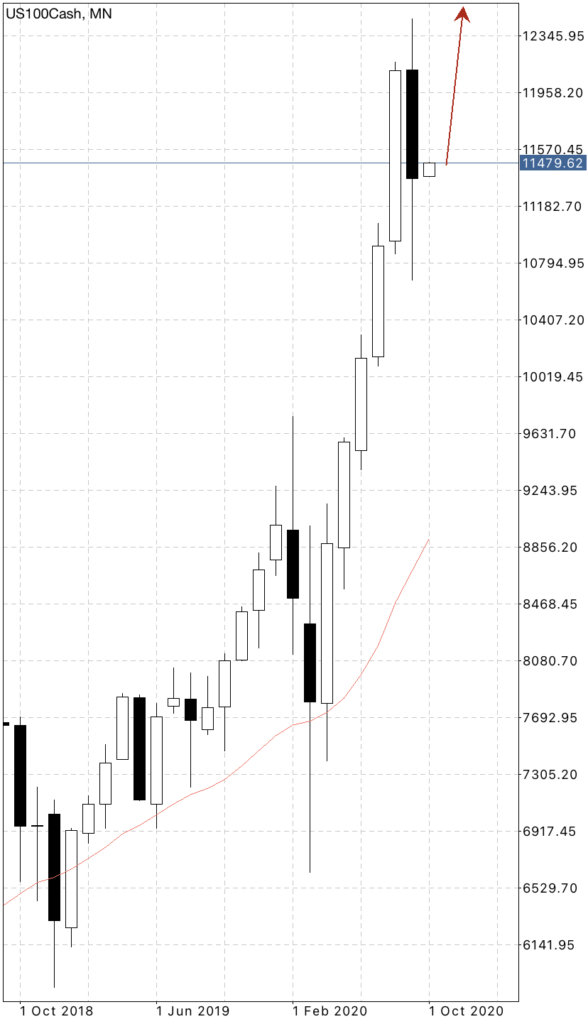
Right So stocks may also continue to rise right over the long term.
![]()
Orli
Just think that even with the risk on, a temporary drop in stock prices could come again, I think buying the stock as much as possible at this stage is a big risk.
![]()
Kanae-san
Well, do you think a temporary drop in the stock price would have an impact on the forex?
![]()
Orli
If a temporary drop in stock prices comes again, there will be no impact on FX Or, if there is, the possibility is conceivable that it is small.
![]()
Orli
Of course, even if the move in the fear index and the 10-year bond was a sign of a falling stock price, it could be a pattern of risk-on, stock price declines not coming, and a pattern of steady growth all the way up The following is a brief description of the process.
![]()
![]()
Kanae-san
I see!
![]()
Orli
There's still a month until the presidential election, so I think we'll see some speculators in the meantime.
![]()
Kanae-san
If you see a big move, please consider it!
![]()
Orli
Okay! Please look forward to it ^^
![]()
Kanae-san
I also want to look at a 10-year speculator's chart to verify it, where can I see it?
![]()
Orli
You can see it here!
![]()
Kanae-san
Thank you!
![]()
Orli
And this time the content is also explained in this video.
![]()
Kanae-san
I'll watch the video again to review it! I learned a lot today ♫
This time, we discuss the Chart of Speculators and the possibility that stock prices will fall again after the US Presidential Election I did, but what did you think?
I hope this helps newbies understand the application of speculative muscle charts.
I hope you use it for your future trades!
ブログの更新通知を受け取る
ページ左下のこちらのアイコンを押せば
ブログ更新時に通知を受け取れます!
(※iPhoneには対応しておりません。)
また、メルマガでもブログ更新のお知らせを配信しています。
ぜひこちらからご登録ください!
↓↓↓↓↓↓↓↓↓↓
最後までお読みいただきありがとうございます。
![The U.S. presidential election may cause the stock market to fall again! Speculative sources to explain! [Forex, Beginner]](https://orli-ch.com/wp-content/uploads/2020/10/ookawaGFVL9724_TP_V4.jpg)


-1-1024x555.png)
-1-1024x578.png)